Uncertainty of Our Model's Results
When presented with the Early Warning Project’s Statistical Risk Assessment, users often ask how confident we are in the results. For example, how sure can we be that the country ranked 10th is at greater risk than the country ranked 20th? Or how sure can we be that a country whose risk estimate is 3% is actually above the global average for 2021-22 of 1.7%?
Before taking up these questions, we should recall what we mean by a “model” and how we understand the estimates our model provides. Our statistical model is essentially a way of saying, “Countries like this, in the past, have seen onsets of mass killing X% of the time.” The “X%” is a reasonable estimate, informed by data, of the chance of a mass killing beginning in that country in the next one to two years.
Below, we explore the uncertainty of our model’s results.
Note: These analyses were conducted in 2021.
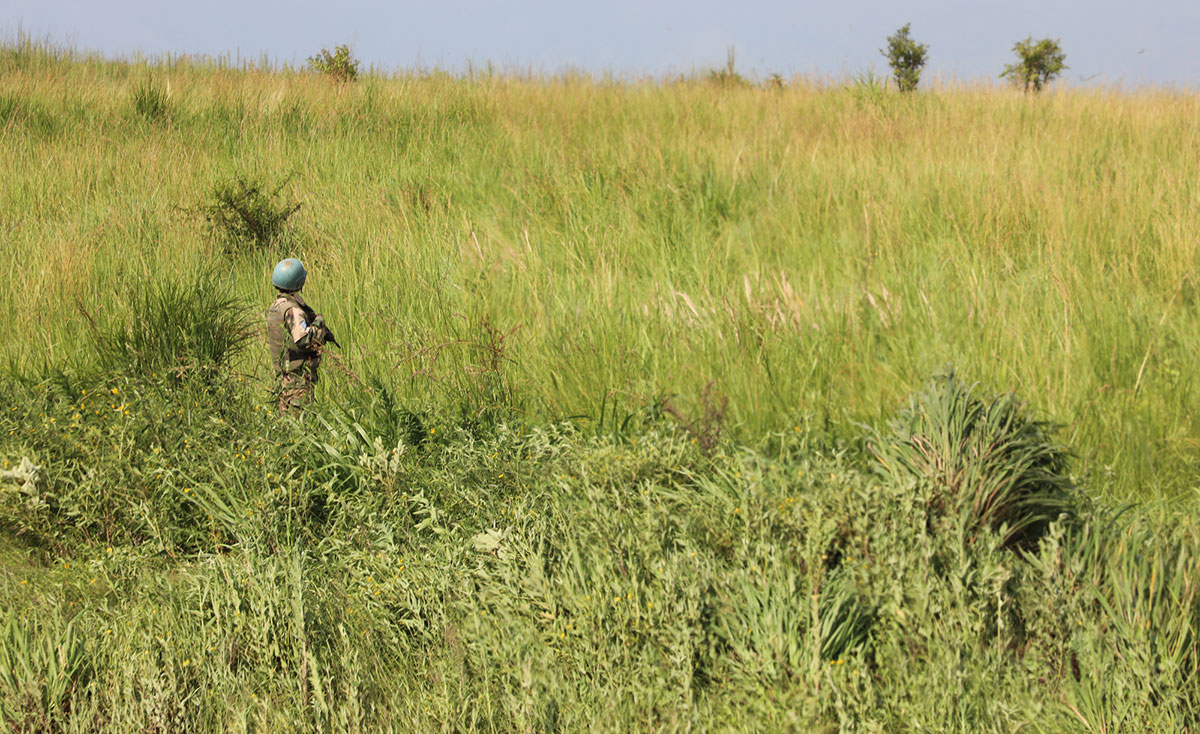
Photo above: A peacekeeper serving with the United Nations Organization Stabilization Mission in the Democratic Republic of the Congo (MONUSCO) seen on patrol. UN Photo/Michael Ali.
Related Pages
Probabilities Express Uncertainty
Regarding uncertainty, the first point to remember is that our risk estimates, like all probabilities, are themselves expressions of uncertainty. If we were entirely certain about whether each country would experience a mass killing event in the next year or two, we would express these as probabilities of 0% or 100%.
Suppose a country A in year T is given a 10% risk estimate. This may be “correct” in that if we could observe many countries like A in many years like T, 10% of them would experience a mass killing. But 10%—equivalent to saying the chance is 1 in 10—is a way of expressing how uncertain we are whether a mass killing will occur.
Beyond this, users might want to know about the uncertainty of our estimates and rankings. There can be different sources for this type of uncertainty, some of which can be analyzed statistically and some of which cannot.
Uncertainty Due to Changes Over Time
One source of uncertainty is that the world might work differently now than it did in the past. Remember, our model depends on recognizing patterns in countries that experienced mass killing in history and looking for the same patterns in countries around the world today. If the relationship between a variable and the risk of mass killing has changed considerably in recent years, the model may not recognize this.
For example, a model that was developed using data mostly from the Cold War period might find that communist ideology is strongly associated with risk of mass killing. If that relationship began to dissipate in the 1980s, those changes would lead to uncertainty in model estimates—at least until those years could be observed and the model adjusted.
Unfortunately, although we can try to ensure that our model adjusts for changes over time in how the world works (for example, by “re-estimating” the model each year), we have no straightforward way to describe how uncertain our risk estimates are based on these changes.
Uncertainty Due to Limited Data
Another source of uncertainty of our risk estimates is the relatively small number of historical cases we can use to develop our model. As with any statistical estimation process, the more data that the model can use to learn, the more precise it will be.
We cannot easily increase the number of observations (country-years) in the way that a pollster can survey more people to shrink the margin of error. But if we make certain assumptions, we can assess how much uncertainty around our risk estimates and rankings results from our being forced to build the model on limited data.
The main assumption required is that data we have from all countries over all years, reflects just “one sample” of what could have emerged from an underlying “data generating process”—that is, an unobservable set of relationships that leads to the particular observed data.
Using an approach called the bootstrap, we can simulate what “another sample from the same data generating process” might look like, simply by “resampling” the data we have. In each “new sample” we might see country A once, or maybe twice, or maybe not at all, but the overall sample size is the same. (For more information on this process see below.) On each such resampled dataset, we can repeat the entire process of training our model and estimating risk for each country. We can then see how much variability there is in each country’s risk score or rank.
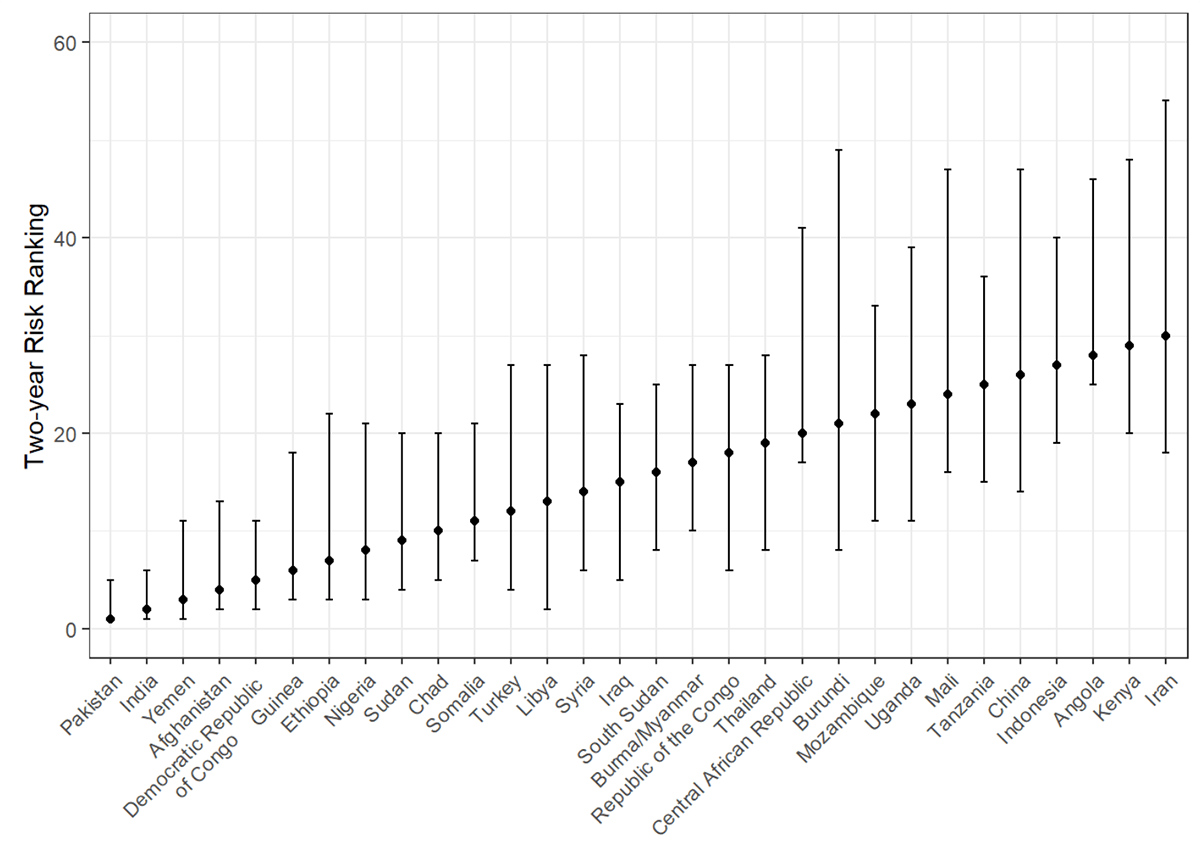
For example, Pakistan has the highest risk score in our 2021-22 model. In this bootstrap analysis, we find that in at least 97.5% of the resamples, Pakistan is ranked in the top-5. For each of the 19 highest risk countries in our 2021-22 assessment, the bootstrap analysis found that at least 97.5% of resamples would still put the country within the top-30, which we normally consider to be the high-risk group meriting additional analysis and preventive action.
Conclusion
In sum, uncertainty is a multifaceted concept. We use probabilities as a way of expressing the uncertainty inherent in our assessment of mass killing risks. We were able to analyze one source of statistical uncertainty (limited data) and quantify the resulting variability in our rankings. We can acknowledge but cannot quantify another source of uncertainty (changes in how the world works). In the end, users should recognize our results as model-based estimates with which they can have reasonable confidence, not perfectly precise descriptions of the world.
Technical Note: Bootstrap Procedure
We perform a simple bootstrap procedure to obtain uncertainty estimates. We hold the set of variables available to each model fixed, using the predictors selected by training the model on the full data. In each iteration, we sample with replacement from all country-years and train the model on the re-sampled data. We then apply the model to the full test data, which includes the variable values for all countries in the year we would like to make predictions from. For each country we retain the predicted probabilities of an onset in the next one or two-year windows, as well as its relative ranking.
Given the low frequency of onsets, there can be large jumps in the base probability of an onset between iterations depending on the country-years selected. Therefore we observe large confidence intervals for the predicted probabilities and instead focus our analyses on the relative rankings of the countries.
For each country we calculate the 95% confidence interval for its rank. The lower bound represents the rank at the 2.5th percentile and the upper bound represents the rank at the 97.5th percentile.
We present two visualizations of the results. Figure 1 shows the results of the bootstrap analysis for the top-5 countries from our 2021-22 assessment. The bars represent how many times in 1000 resamples the country’s risk was of a particular ranking, the gray area represents the 95% confidence interval, and the blue bar represents the country’s ranking based on the original sample.
Figure 1: Histogram of rankings from 1000 bootstrap resamples
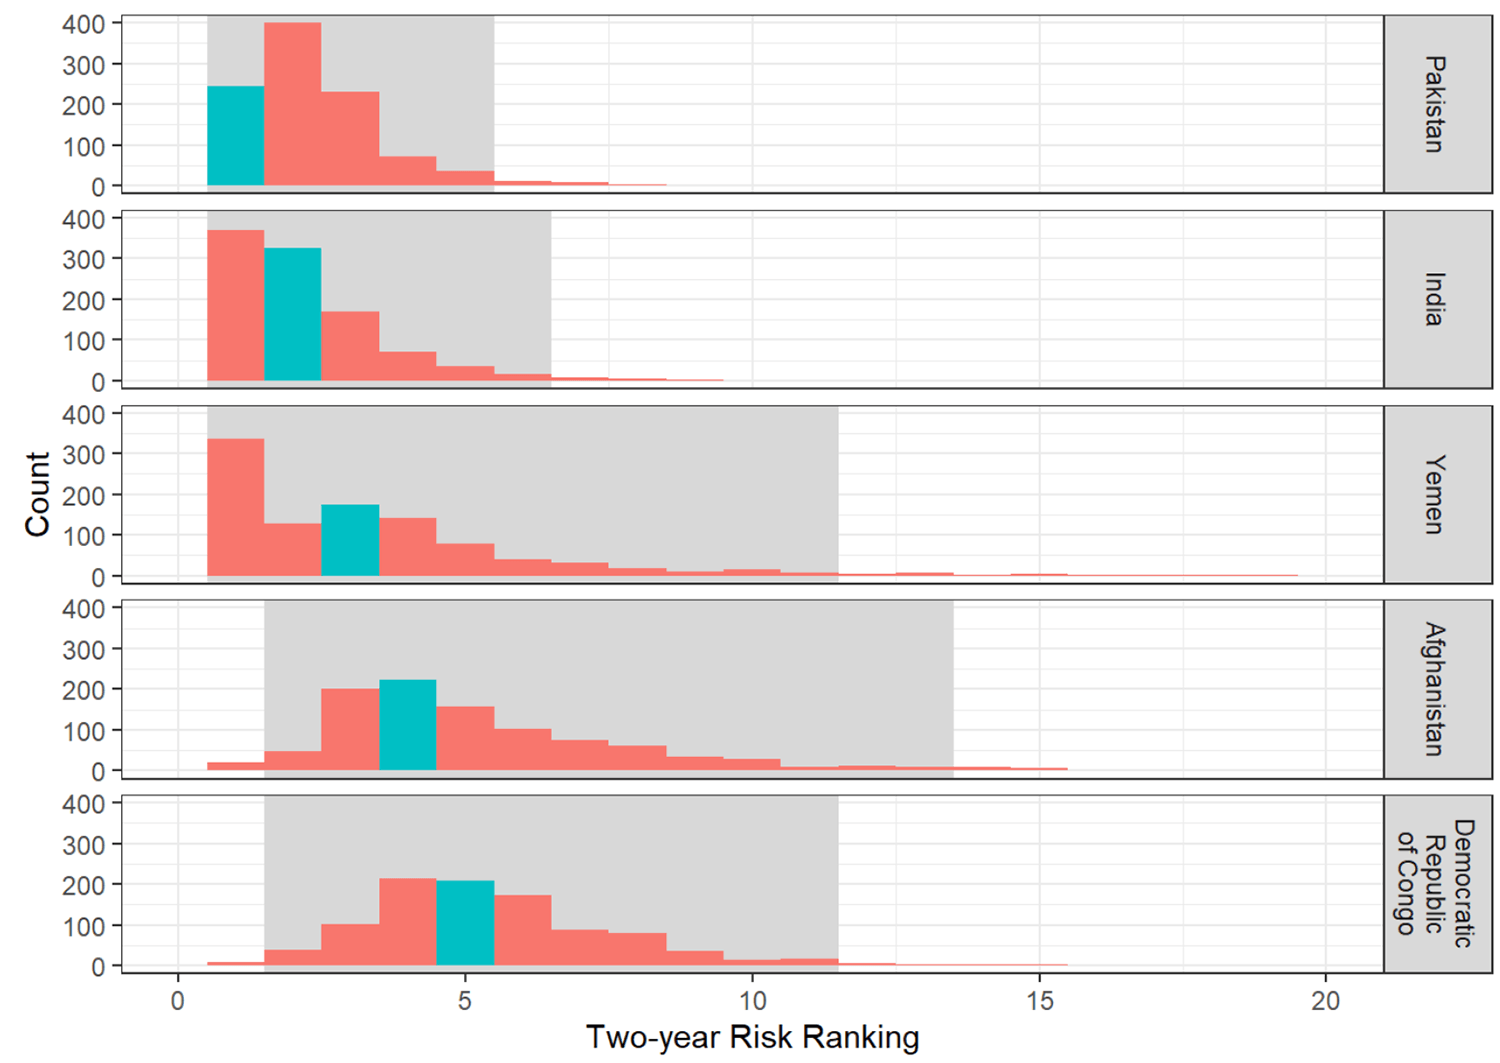
Figure 2 shows the same results for the top-30 countries from our 2021-22 assessment. The points represent the countries’ rankings based on the original sample. The vertical bars represent the 95% confidence interval. For example, Iraq (ranked 15th in the 2021-22 assessment) has a lower bound of 5th and an upper bound of 23rd.
Figure 2: Confidence intervals from 1000 bootstrap resamples